Product / Knowledge Base / 10. Analytics and Reports

10. Analytics and Reports

User & Administration Guide — Version 1.0.0.59

Guide summary

Analytics shows completions, pass rate, and assignment status. Manager Reports lists completions for Microsoft Graph direct reports.

On this page

10.1 Analytics

  • Open Analytics for completions, pass rate, average score, and assignment-status charts — including Failed.
  • Use the charts to see which assessments need more attempts, coaching, or a content update.
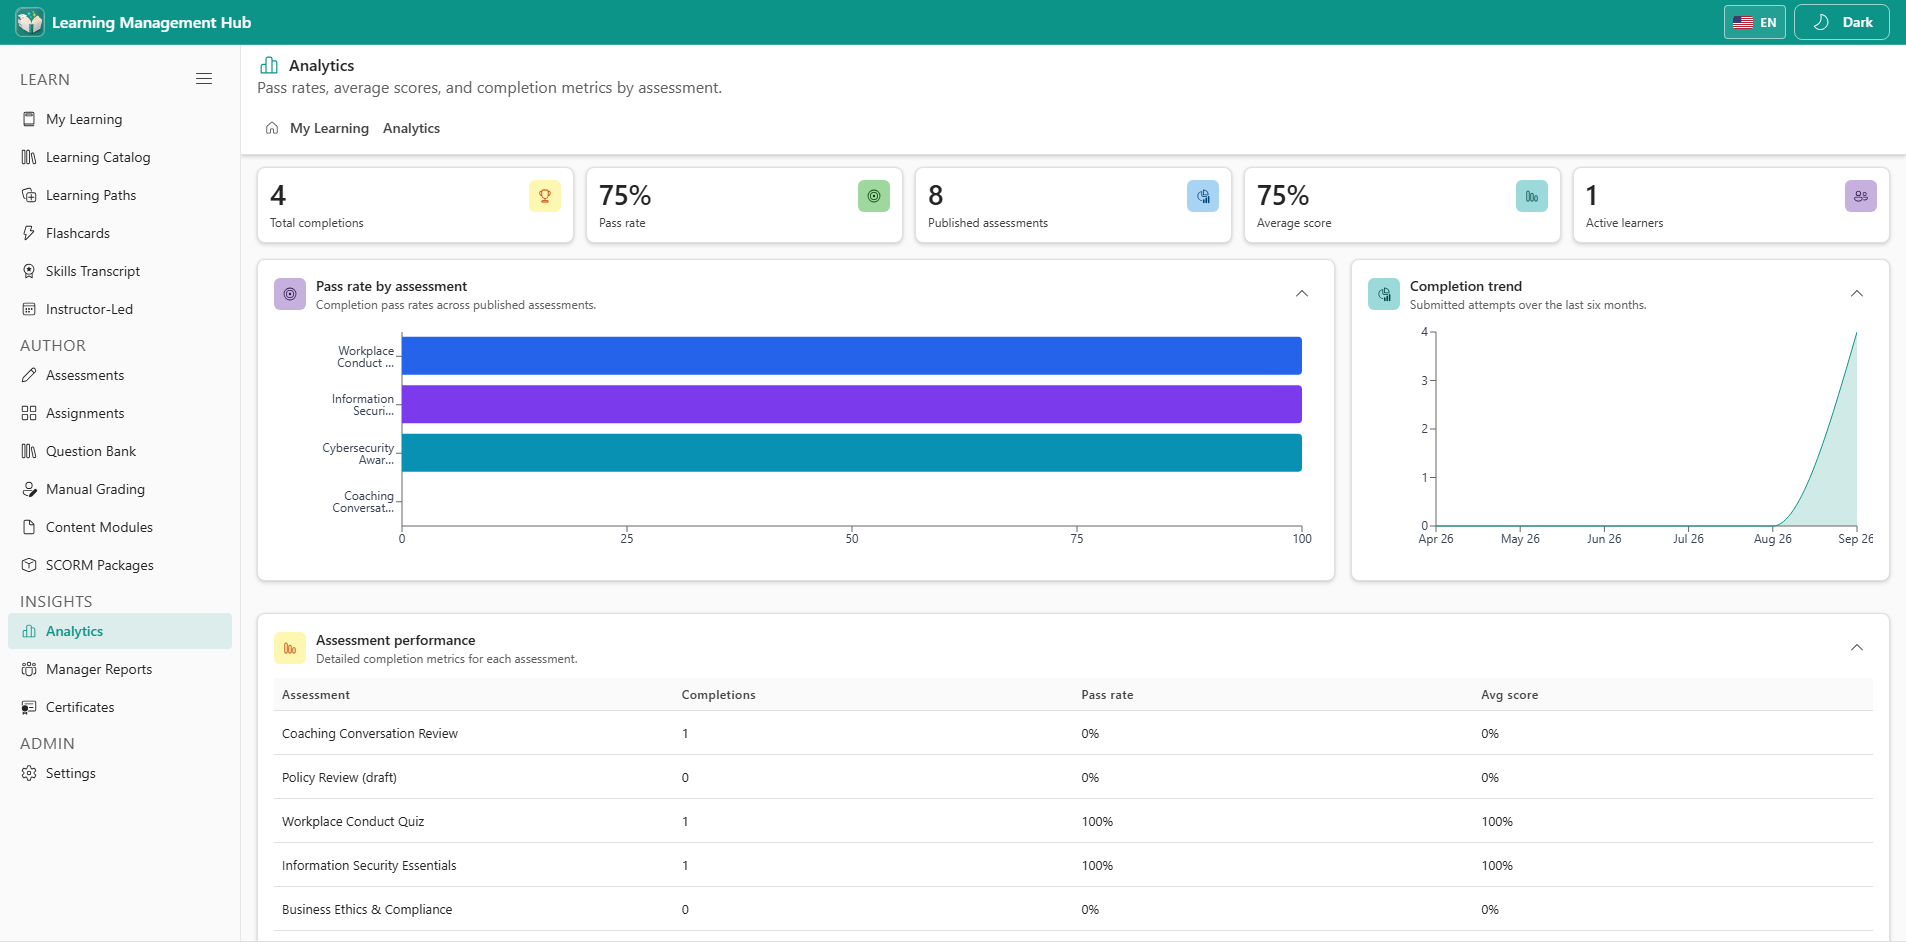
Analytics with completions, pass rate, and status charts
Analytics — completions, pass rate, and assignment status including Failed.

10.2 Manager reports

  • Open Manager Reports to see completions for Microsoft Graph direct reports.
  • This view needs optional Graph consent. Without it, managers still use Analytics for site-wide figures.
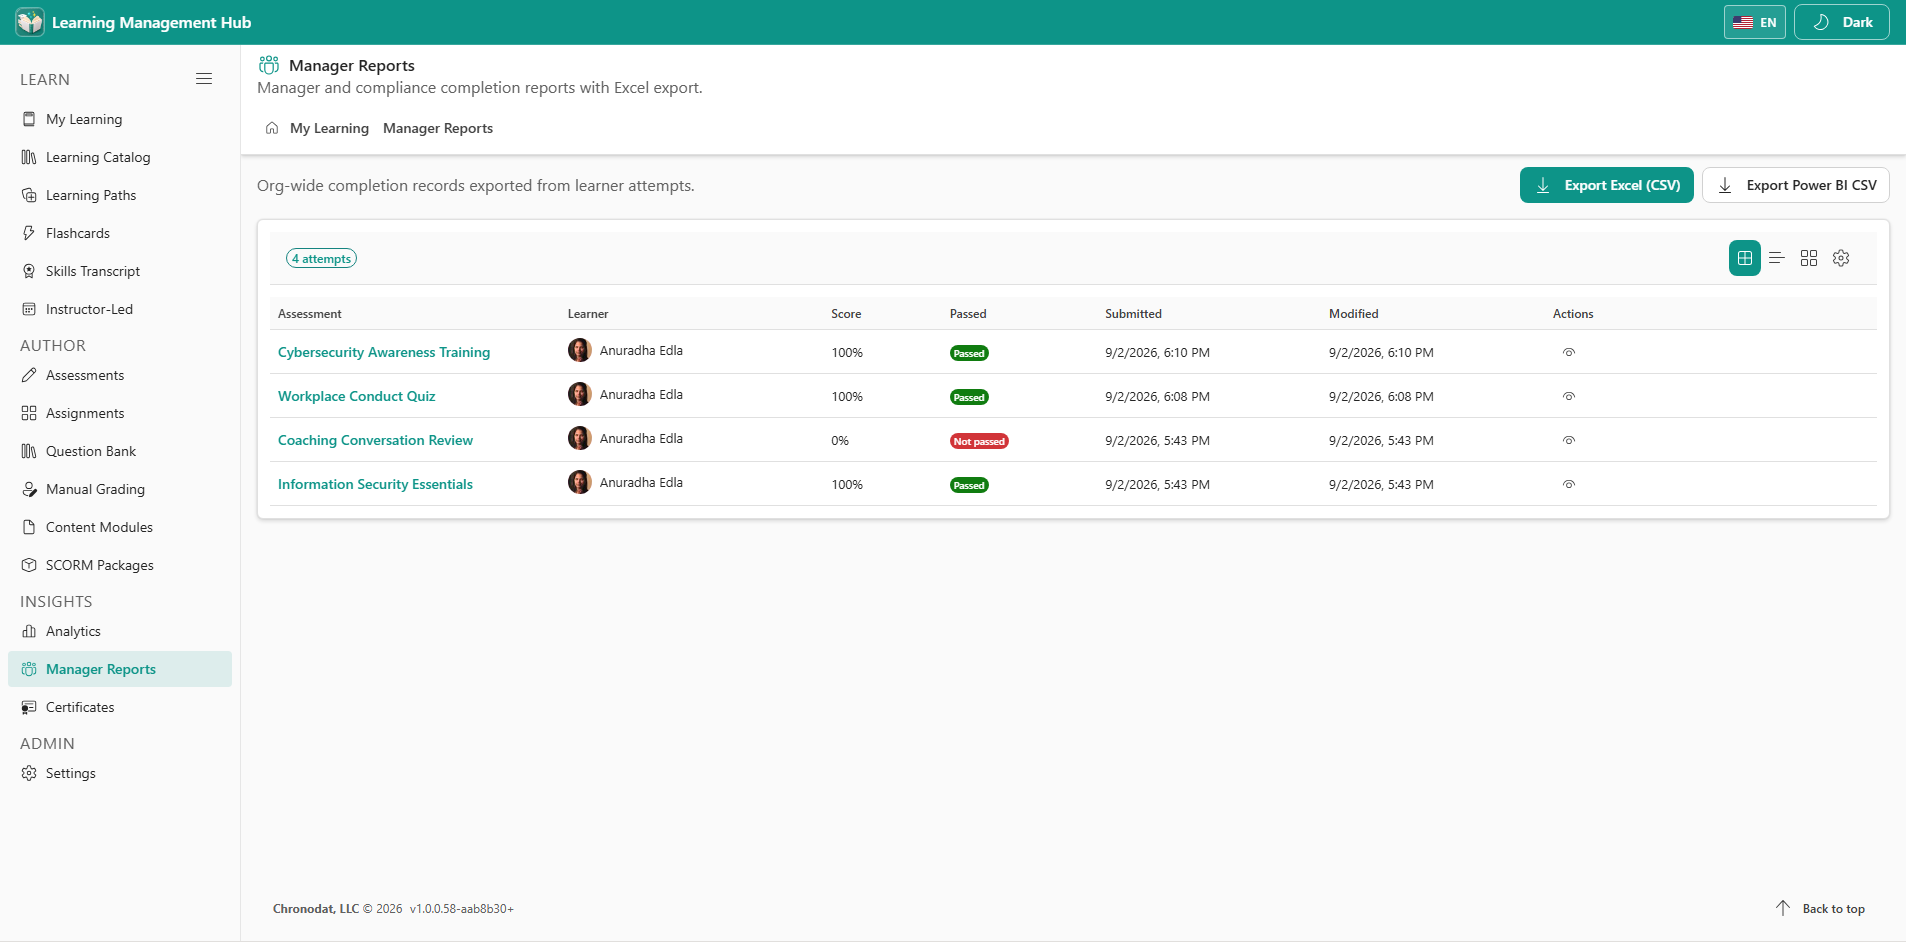
Manager Reports for direct-report completions
Manager Reports — team completions for direct reports when Graph consent is granted.