4.1 Using the Dashboard
- Open Dashboard from the sidebar Main section.
- Review the summary cards: Open, In Progress, Closed, Critical count, and average risk age.
- Use the portfolio filters in the top bar to scope every widget to a business or project.
- Click a cell on the inherent risk heat map to drill down to the matching risks.
- Review the severity, status, and priority charts below the heat map.
- Use the latest-risks table tabs (Latest, Assigned to me, Overdue, and more) to jump to items.
- Click Print dashboard, when available, for a print-friendly layout.
4.2 Risk Rating Page
Open Analysis → Risk Rating. The inherent and residual matrices appear side by side. Residual ratings use explicit potential likelihood and impact when these are set; otherwise they are derived from control effectiveness. Click matrix cells or risk names to open details.
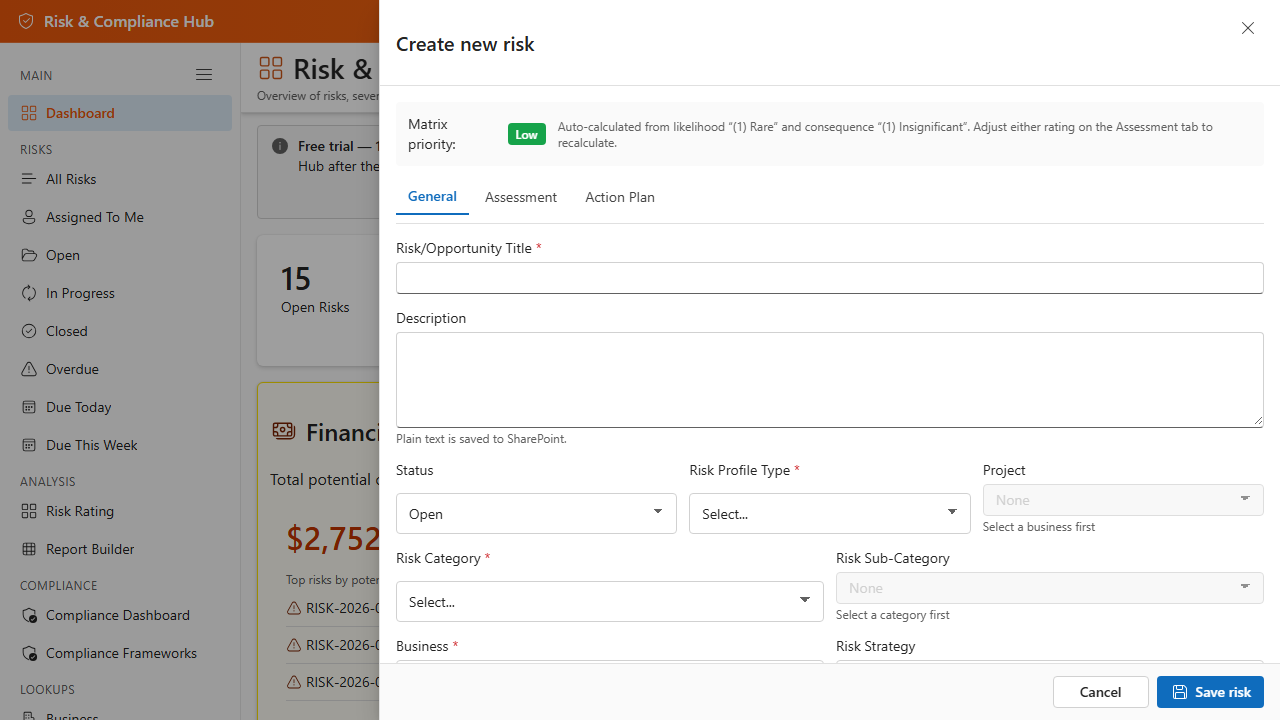
4.3 Matrix Priority
Matrix priority (Critical, Major, Moderate, Low) is calculated from Likelihood × Impact using the scales configured under Settings → Likelihood Scale and Consequence Scale. Custom priorities defined in Settings are organizational labels stored for future use and are separate from matrix priority.
4.4 Print and Export from Analytics
- Dashboard — click Print dashboard, when available, for a print-friendly layout without navigation chrome.
- Compliance Dashboard — use the print action to capture posture summaries for audit packs.
- Risk Rating — use browser print (Ctrl+P) to snapshot the matrices; portfolio filters apply to the displayed risks.
- Report Builder — export filtered datasets to CSV for Excel, Power BI, or archival (see Section 7).
Additional App Functionality
Dashboard Display Settings
Administrators can tune dashboard behavior from Settings. Common options include the dashboard title, heat-map hover details, and whether financial exposure values are shown. These settings help match the dashboard to executive, operational, or privacy-sensitive audiences.
Print-Friendly Outputs
The Risk Dashboard and Compliance Dashboard include print-friendly layouts for status packs, audit evidence, and steering committee updates. Apply business or project filters first, then print the focused dashboard view.