5.1 Who Can See the Dashboard
The Dashboard tab is visible to users listed in Management users or Management groups in access control settings. Site owners and app administrators always have access. If you do not see the tab, contact your SharePoint or Teams administrator.
5.2 Dashboard Contents
- Headcount and organizational breakdowns
- Department and location distribution
- Presence sample statistics
- Charts configurable by administrators
Click Refresh to recompute analytics with the latest Microsoft 365 directory data.
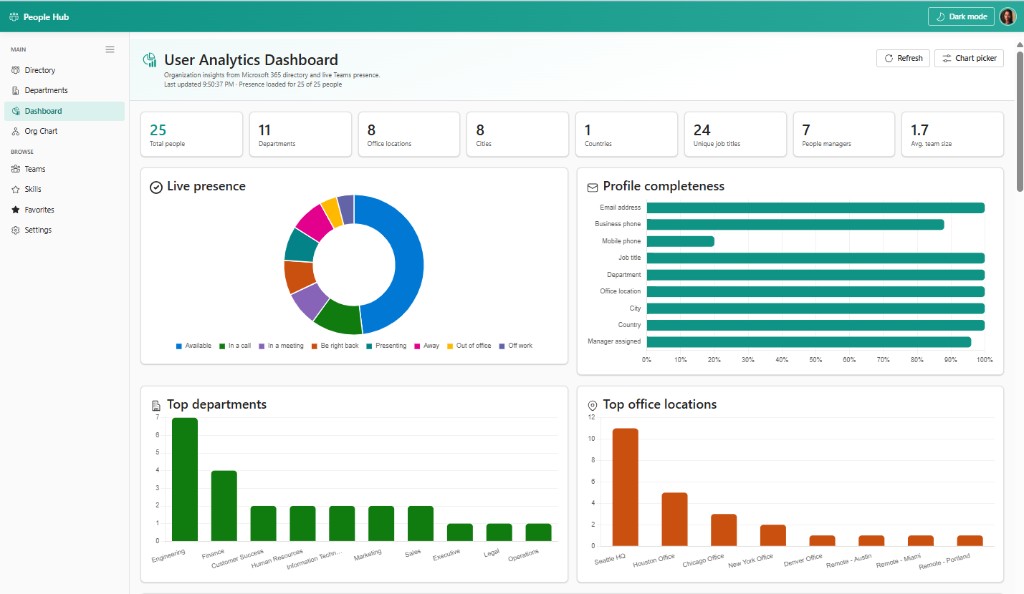
The dashboard summarizes your tenant at a glance. Summary cards across the top show total people (25), departments (11), office locations (8), cities, countries, unique job titles, people managers, and average team size. The Live presence donut reflects real-time Teams status for the sampled population. Profile completeness bars highlight data quality gaps — mobile phone is often the lowest-filled field. Top departments and Top office locations bar charts help HR and leadership understand organizational distribution. Use Refresh and Chart picker to update data and choose visible widgets.