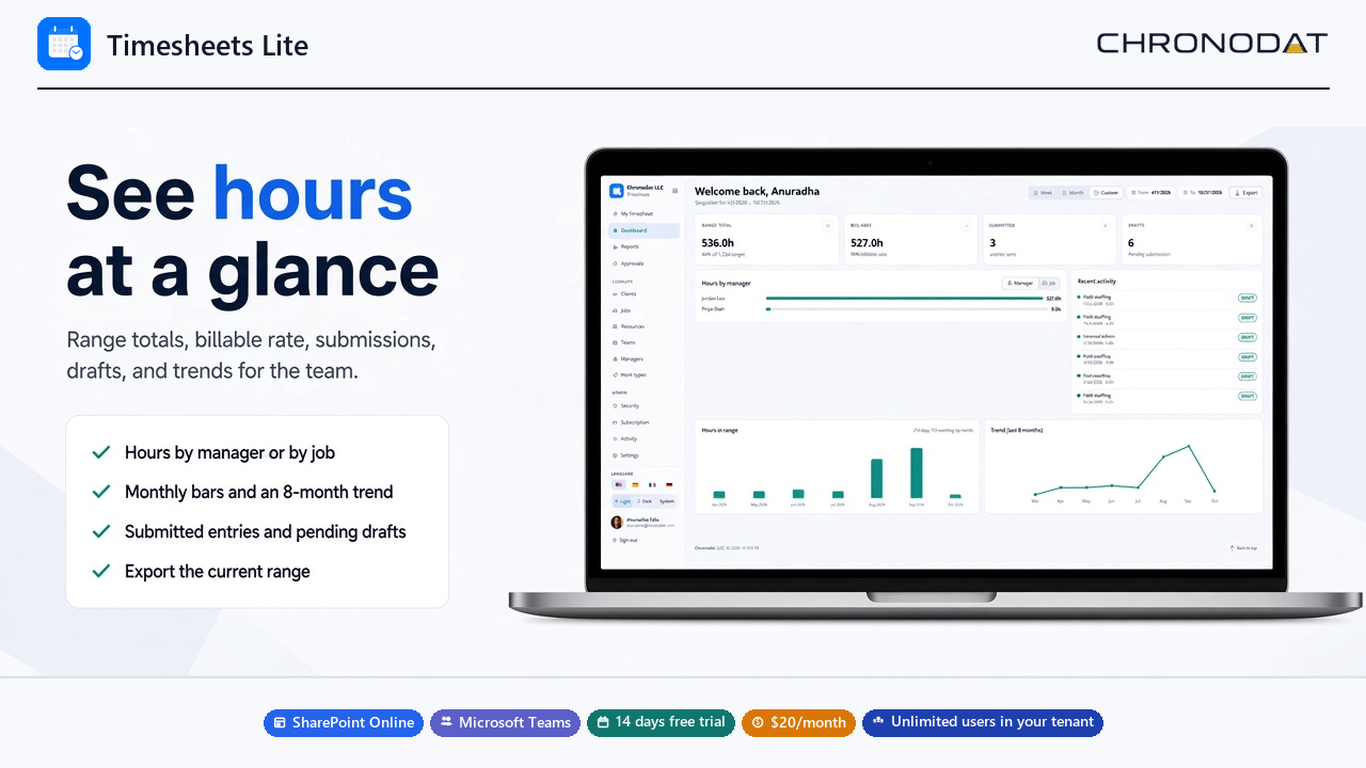
Dashboard
- KPI cards show hours for the selected period, including billable and non-billable totals.
- Trend charts show how hours move across weeks.
- The numbers follow the weeks and people you are allowed to see.
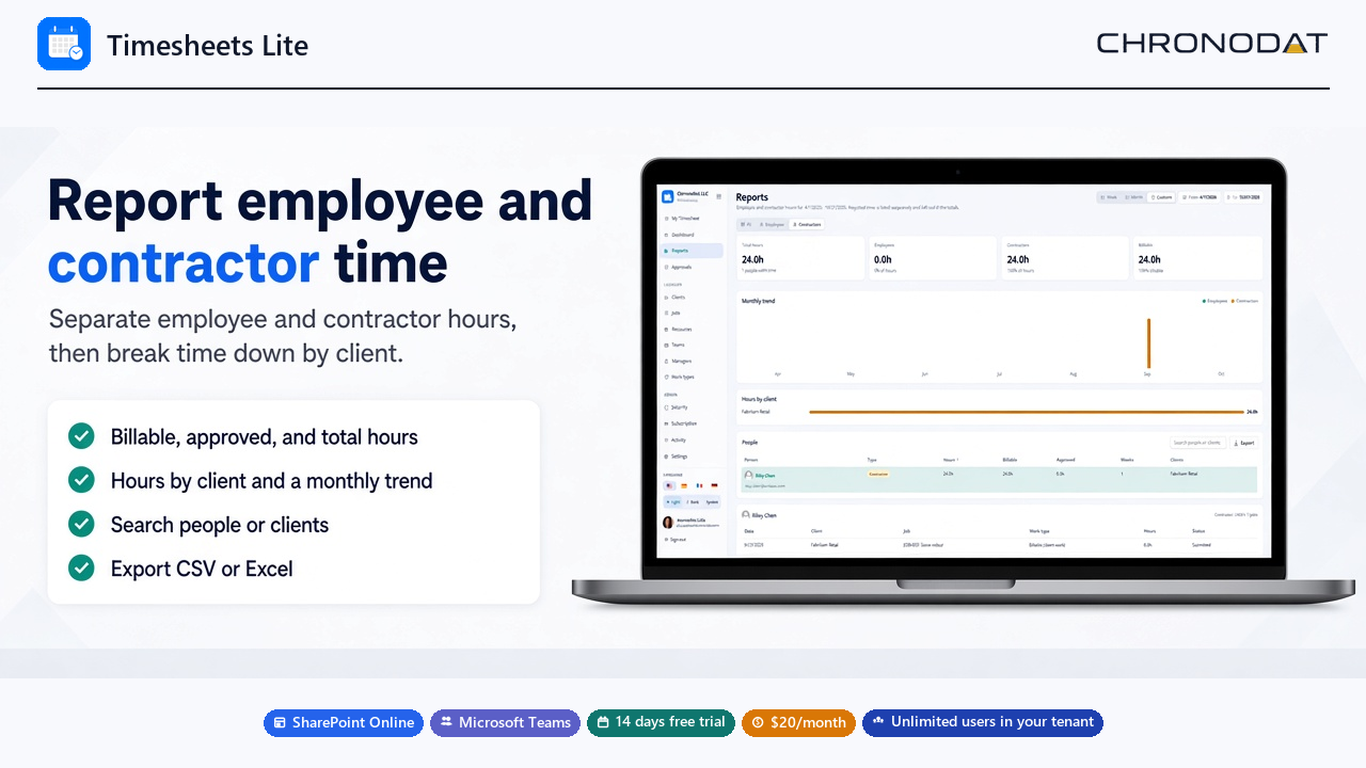
Reports
- Filter by date range and by audience: everyone, employees, or contractors.
- Employee and contractor totals are listed separately. People who logged time without a resource record appear as unlisted.
- Hours by client shows where the time went.
- Export the current report to CSV or Excel.